
Learning to Learn with AI: Notes on Anthropic’s Economic Index
A read-through of the March 2026 Anthropic Economic Index report, with some data explorations of my own.

Anthropic released the latest edition of their Economic Index this week. This is a report that tracks how Claude is being used across the global economy. This is the third such report, covering a sample from early February 2026. You can find the earlier reports here. The focus of this report is an important question: do people get better at using AI over time, and if so, how?
There is another reason this report is interesting. It maps to the time Anthropic ran those Superbowl ads (and if you’ve not seen them, here. Go watch, they’re a lot of fun, and will remind folks of a certain age of another series of ads. The more things change…)
In today’s blog post, I want to walk through what I found most striking (all three: the good, the bad and the uncertain), and share some original analysis — including a look at my own usage data over two-plus years of working with Claude.
The Adoption Curve is Working
The first chapter of the report is about something unsurprising but worth noting: usage on Claude.ai is diversifying. The top 10 most frequently asked for tasks accounted for 24% of all conversations in November 2025, but only 19% in February 2026. Non-top ten tasks have a higher percentage share, and what that means is that claude.ai is beginning to grow a tail, and it may well be a long one.
The other big and unsurprising finding is that coding is migrating from the consumer interface to the API. This is largely via Claude Code, which (among other things) splits work into smaller agentic calls. Meanwhile, personal use — sports scores, product comparisons, home maintenance — rose from 35% to 42% of Claude.ai conversations. Many more people are using Claude.ai, and those of us who have been using it for a while are increasingly using it for more complicated stuff, and both are Mostly Good Things.
This data was collected between February 5–12, 2026. This is before the Anthropic-Pentagon confrontation, and if you haven’t read about that, you have some catching up to do. The SCR designation came on February 27, and Claude exploded in popularity almost immediately after. So the diversification story here is driven by Anthropic’s Super Bowl advertisements (which the report explicitly credits) and organic adoption, not the DoW drama. The next Economic Index report will therefore make for even more fascinating reading.
But we have the earlier data to analyze in this report, and it makes for rich reading. As the report itself says, this is a textbook adoption curve case study. Early adopters will typically cluster around specific high-value use cases, which in this case mostly means coding. Later adopters bring a much wider, more casual range of tasks. The average estimated value of work done on Claude.ai (as measured by US wages for associated occupations) dipped slightly from $49.3 to $47.9 per hour. Why should it dip? This ties back to the long tail point I made above - more people are using Claude.ai than was the case earlier, and that means usage will diversify.
Three Inequalities Worth Worrying About
As an economist, the inequality findings are where I linger longest. The report touches on geographic convergence, but I think there are actually three distinct inequality stories buried in the data, and they don’t all point in the same direction.
First, within the US, convergence is continuing. The share of per-capita usage going to the top five states dropped from 30% to 24% since August 2025. The Gini coefficient has fallen. This is good news, because it suggests that knowledge about what AI can do, and how to use it, is diffusing within the United States. But the pace has slowed. Early estimates suggested states would converge to roughly equal usage in 2–5 years, but Anthropic now says that the updated estimate is 5–9 years. I’m not sure why this should be so, and it is a minor puzzle.
Second, across countries, divergence is increasing. The top 20 countries now account for 48% of per-capita usage, up from 45% from the earlier report. This is the opposite of the within-US story, and it worries me more. Supply-side inequality (who has access to AI models) is one thing, and it is bad enough. But demand-side inequality (this is weird terminology for an economist to use, but these are weird times) is stickier and potentially more consequential. Why? Because it hints at differences in institutional culture, work patterns, and organisational willingness to experiment with AI. These are not easy things to change! If you think of access barriers as transaction costs (in the Coasean sense), supply-side costs can be lowered with better infrastructure, policies and pricing. The mental models and habits determine whether a country’s institutions even try to integrate AI into their workflows. Early days, to be clear, but this is something to keep an eye on.
Third — and this is the one the report hints at but doesn’t fully develop — within lagging countries, inequality is likely even worse. The report notes that in low-adoption countries, the user base is still dominated by technical early adopters doing high-value work. This looks like sophisticated usage, but it actually reflects a slower adoption. These countries show divergence between them and leading countries, while also showing extreme concentration within their own populations. This is not good news. This paper is worth reading in this context.
The report’s own learning-curve findings make this worse. If experienced users get better at using AI, and early adoption is self-reinforcing, then the countries that are behind today will fall further behind tomorrow. And that too in the most important resource of them all: the accumulated human capital of knowing how to work with these tools. Metis in AI compounds, and more people in more countries need to be working every day to acquire it
The Primitives: Statistically Significant but Small
Economic primitives are simple, foundational measures of the ways that Claude is used. Here are some key statistics: the average education years needed for prompts is down from 12.2 to 11.9 years, and human-only task completion time is down by about 2 minutes. All differences are statistically significant at p<0.001.
But with a sample of one million conversations, statistical significance isn’t the real story in my opinion. What matters is the magnitude of the effect, and these changes are small potatoes, no? The 0.3-year drop in education level and the two-minute reduction in task time are real, but how noteworthy are they, really? We’re still in the early days of telling ourselves stories about AI adoption, so I’d say these are worth tracking over time in case they become trends, but not worth building an argument on today.
Who’s Picking the Smart Model — and Who’s Not Even in the Room?
The report’s analysis of model selection is one of its genuinely new contributions. Users choose Opus (Anthropic’s most capable model) for tasks associated with higher-paying occupations. For every additional $10 of hourly wage for a task, Opus usage increases by 1.5 percentage points on Claude.ai and 2.8 percentage points on the API.
I think this finding is slightly open to misinterpretation if read as “higher-paid professionals use Opus more.” What it really shows is that people pick the more powerful model when the specific task demands it. A software developer may pick Opus because a particular problem demands the best reasoning available. An academic, by contrast, may pick Sonnet. Why? Because the per-conversation (per task, to use Acemoglu’s framing) cognitive requirement is lower, even though teaching itself as a whole is complex work.
I suspect Opus’ share would correlate even more tightly with users’ own assessment of what percentage of their tasks can be automated. The people reaching for the most powerful model are the ones whose work most directly maps onto what AI can do. It would be interesting to look at what the understanding is, by profession, about what chunkable tasks their daily workflows can be broken down into.
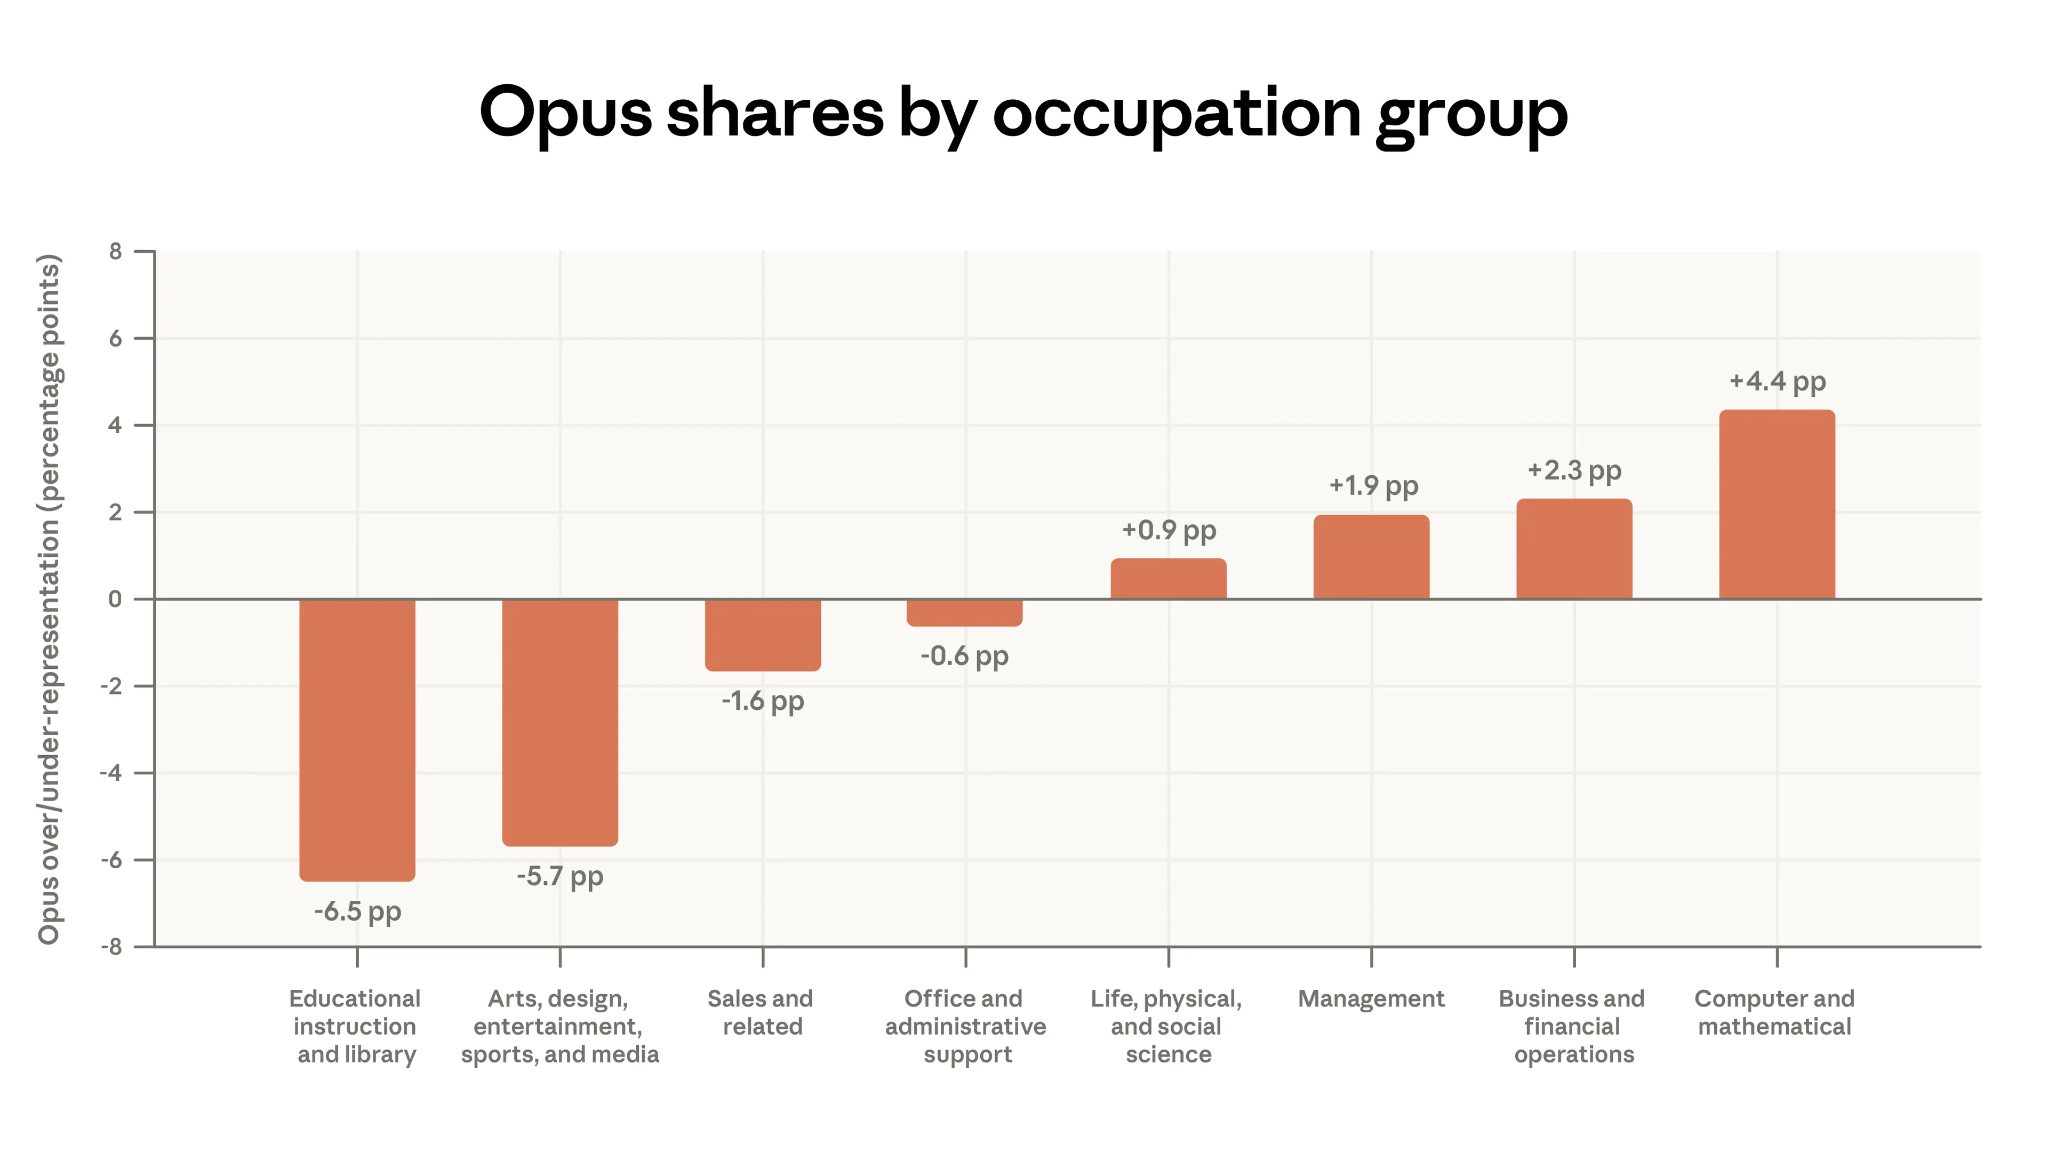
The Gap: High Wages, Low Exposure
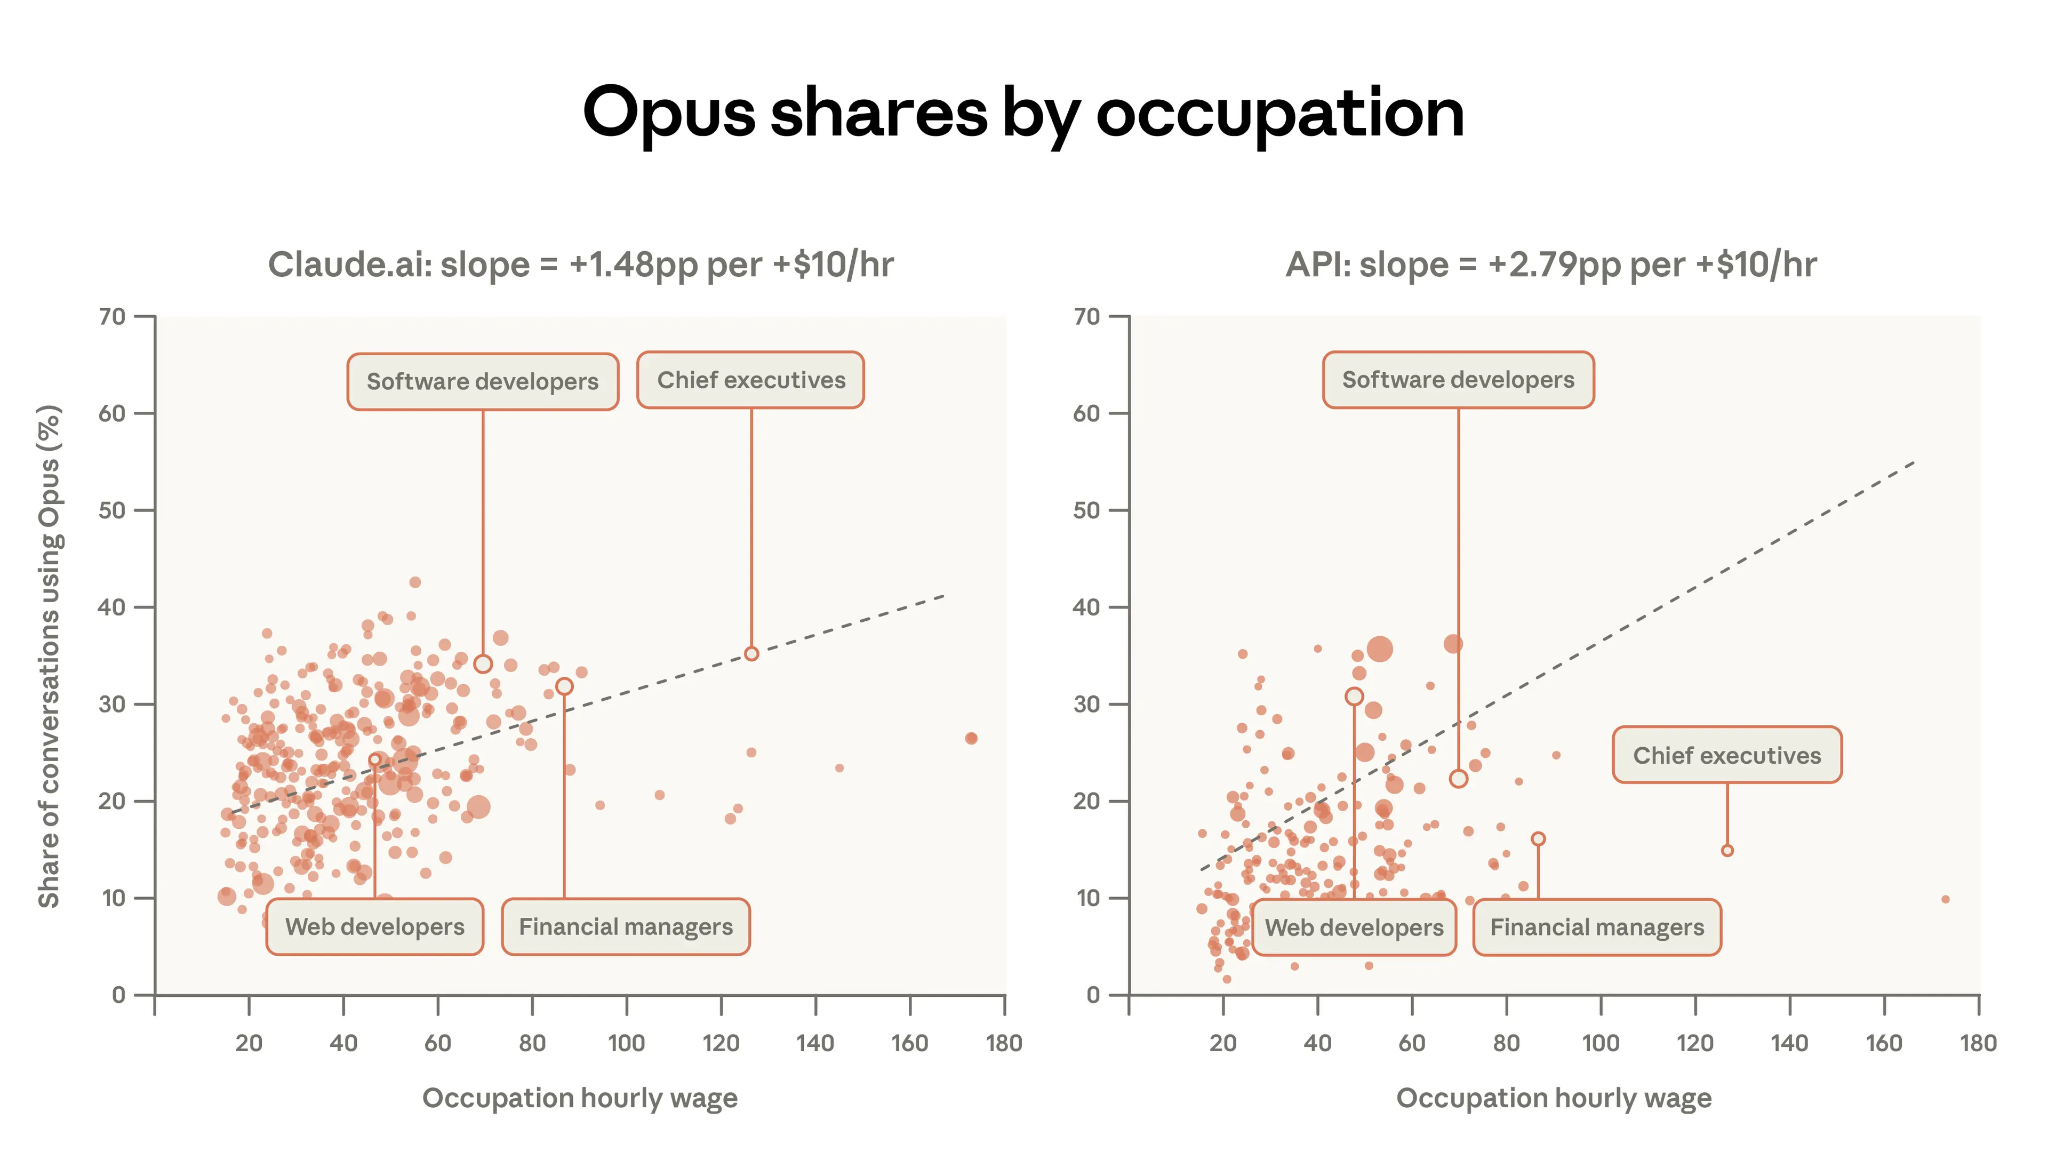
I was curious about those occupations that sit towards the lower right of the charts. These are folks with high hourly wages, but low share of conversations using Opus-class models. Here’s Claude Code’s take on these, after it did its thing:
The occupations missing from AI adoption fall into three clusters:
Healthcare practitioners make up the largest group — physicians, dentists, physical therapists, occupational therapists. Their core work involves physical examination, hands-on treatment, and regulated clinical decision-making. When physician tasks do appear in Claude data, 82% of the time it’s patients asking about their own symptoms, not doctors using AI for clinical reasoning.
Senior managers and executives form the second cluster. Chief Executives, Engineering Managers, Sales Managers — their work centres on relationships, judgement calls, and organisational politics. When CEOs show up, their top task is operational analysis — a support function, not the strategic and interpersonal work that defines the role.
Engineers in physical domains round out the list. Civil, environmental, marine, and industrial engineers. Unlike software engineers, their work involves site inspections, physical materials, regulatory compliance, and specialised tools like CAD software. Their Claude tasks, when they exist, tend to be administrative — budgets, specs documents — not engineering design.
What will it take to change this is a question that I am sure engages the best and brightest minds in all of the major AI labs. The next wave of AI impact for these professions won’t come from chatbots getting smarter. It will come from AI being embedded in the domain-specific tools they already use — electronic health records, CAD software, project management platforms, for example. The interface matters as much as the intelligence, partly because workflows really matter to these guys. In Coasean terms: the current chat interface imposes a transaction cost. You have to chunk your work into text friendly subtasks, translate your domain expertise into prompts, and finally, you have to figure out a way to get the LLM’s output back into your workflow. For a software developer, the cognitive load to do this is near zero. For a dentist today, it’s enormous.
Learning Curves: The Report’s Core Finding
The report’s second chapter asks a great question: do people get better at using Claude over time? I’d love to find out how the team at Anthropic chooses the main focus for each of these reports, because this one is a lovely pick.
And the answer to the question is a resounding yes, and that along multiple dimensions.
High-tenure users (6+ months) compared to newer users show:
10% fewer personal conversations, 7 percentage points more work usage
6% higher education level in their inputs
More collaborative interaction patterns, less directive delegation
Greater task diversity (less concentration in top-10 tasks)
10% higher success rate in their conversations
That last number is important. And it survives increasingly stringent controls. When you compare high- and low-tenure users doing the exact same task (using task fixed effects), the gap shrinks to about 3 percentage points. When you add controls for model choice, language, country, and use case, it moves back up to about 4 percentage points. That’s what the chart below is showing you.
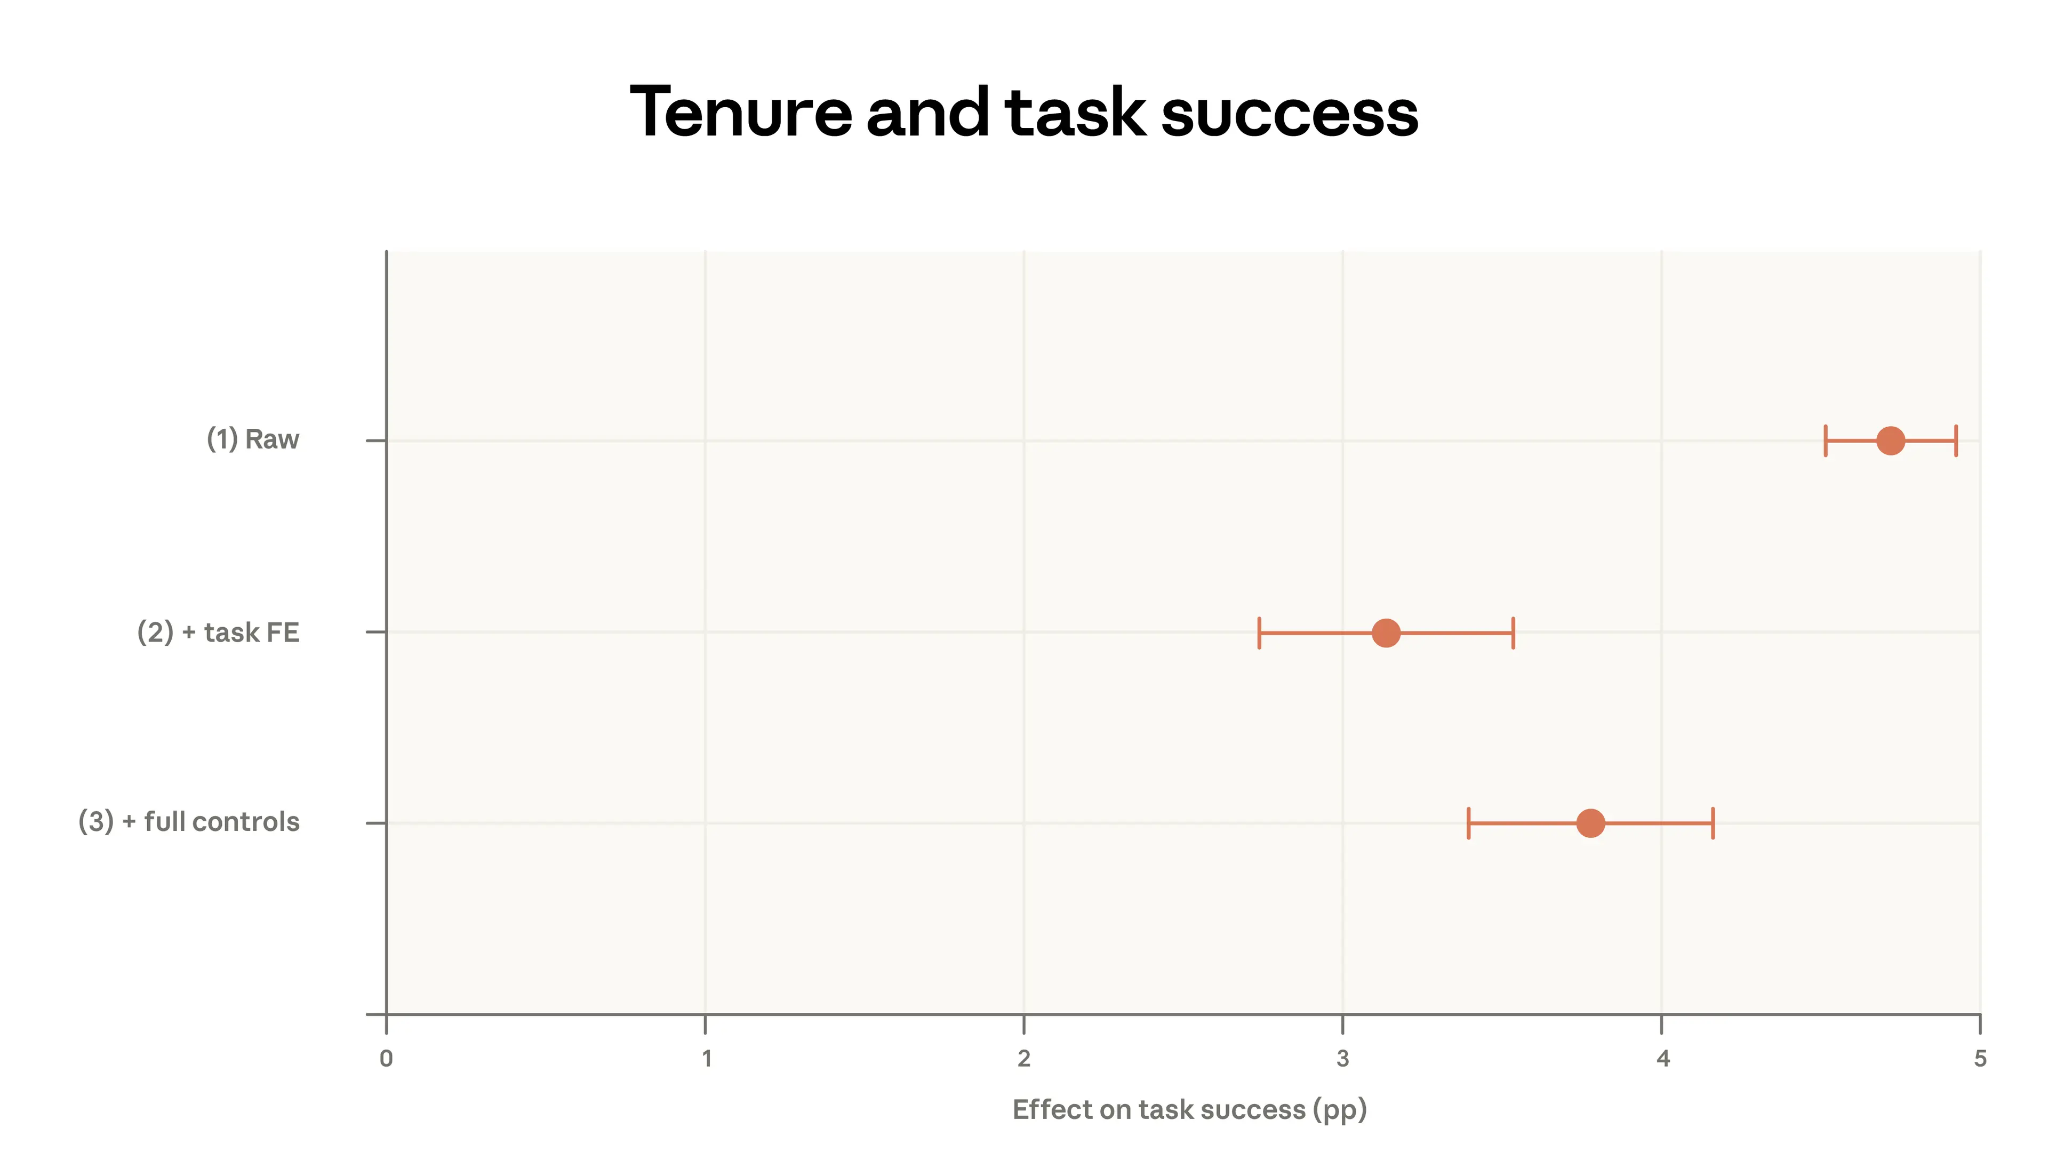
This is evidence consistent with learning-by-doing. Given the same task, the same model, and the same language, experienced users still get better outcomes. The report is appropriately cautious about alternative explanations (cohort effects and survivorship bias could obviously play a role, for example), but the controlled regressions rule out the simple versions of those stories.
The central explanation that they offer has a concrete TMKK: use these tools more. The more you use these tools, the better you get at using these tools. The report makes this connection explicitly in its conclusion. Early adopters with high-skill tasks have more successful interactions, and these same users may be simultaneously the most exposed to AI disruption and most aided by it. The people who learned to work with AI earliest are pulling ahead. The ones who haven’t started yet face a compounding gap. Please, use these tools.
One Concern: The Imagination Ceiling
The data shows that the years of education needed to understand user prompts increases by almost 1 year for every additional year of Claude usage. That is Very Good News, because it shows that users are getting better at using these tools. But the relationship appears to taper off after roughly a year of use.
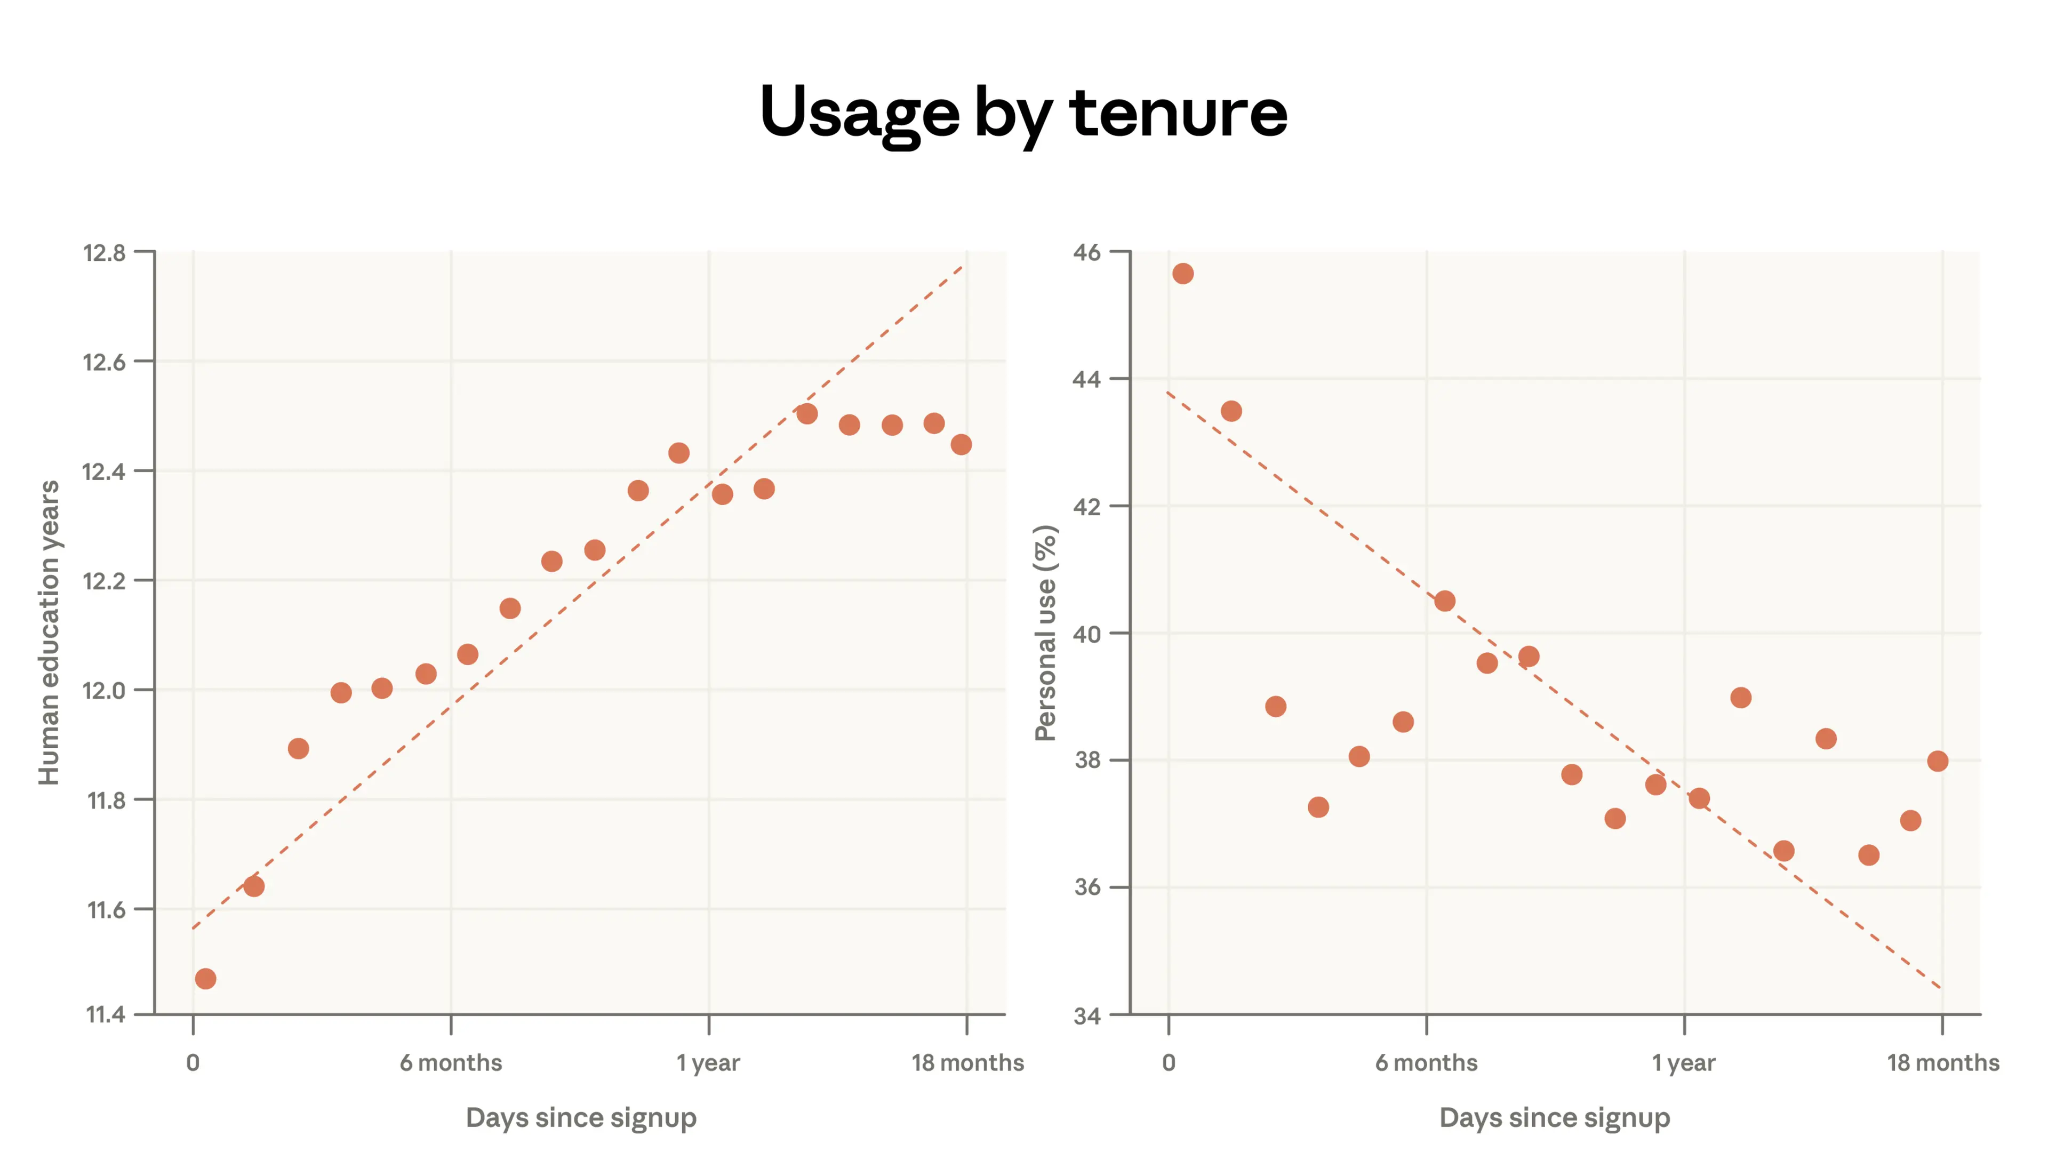
This is a problem of a lack of imagination, maybe? People get better at using Claude for what they already know to ask for, but they may not learn to ask for qualitatively different things. Folks can now do what they were already doing better, and faster… but we still have not gotten good enough at figuring out what else we can do with these tools. If that is indeed what is happening, it’s an important finding. It would mean that even experienced users aren’t scaling up ambition, just scaling up efficiency.
The report’s other finding — that high-tenure users are more collaborative and less directive — is somewhat reassuring here. They’re iterating with Claude, as opposed to just issuing commands. But the plateau in prompt complexity suggests limits to how far that collaboration extends.
I want to offer a gloriously unscientific framework for thinking about this. Consider a simple 2×2:
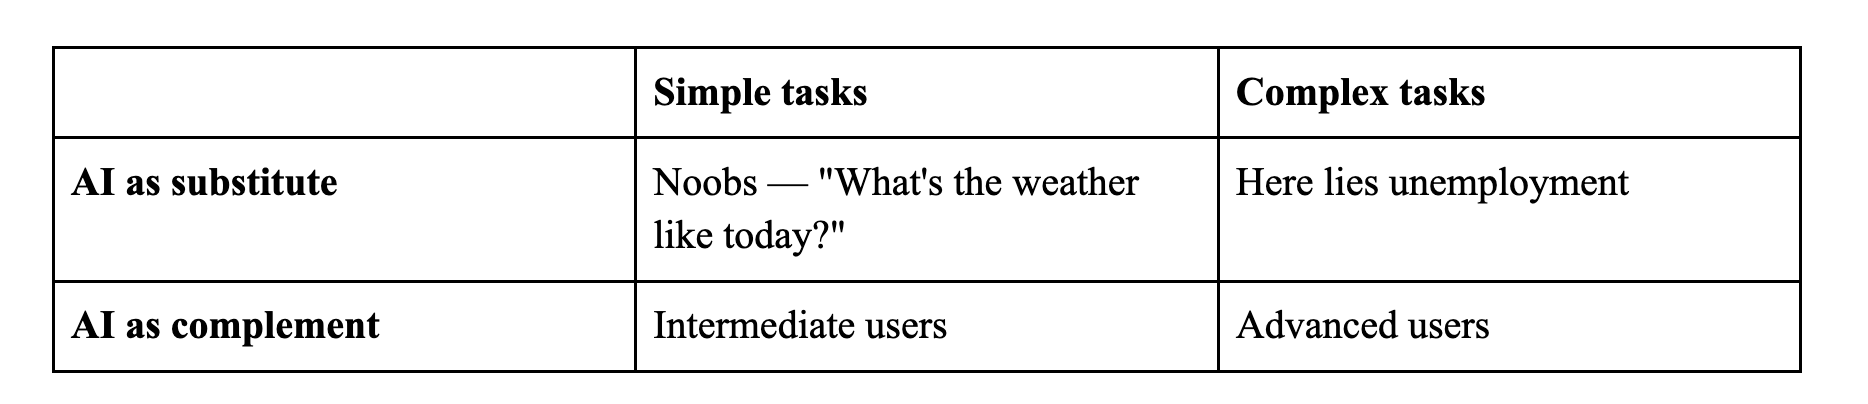
New users treat AI as a substitute for simple tasks, say as a better Google search. Intermediate and advanced users learn to treat it as a complement for complex work. The danger zone is when people start using AI as a substitute for complex tasks, delegating without understanding. This is what we should watch for. So far, the data is reassuring: advanced users collaborate more, not less. But that could change as models become more capable.
N=1: My Own Learning Curve
To make this concrete, I ran the same kind of analysis on my own Claude usage data. I exported my conversation history and had Claude Code classify each conversation by task category, complexity, interaction pattern, and platform — with everything anonymised. I’ve been using Claude for roughly the last two and a half years, and this covers Claude.ai conversations and Claude Code sessions, but not Claude CoWork.
A few things jump out:
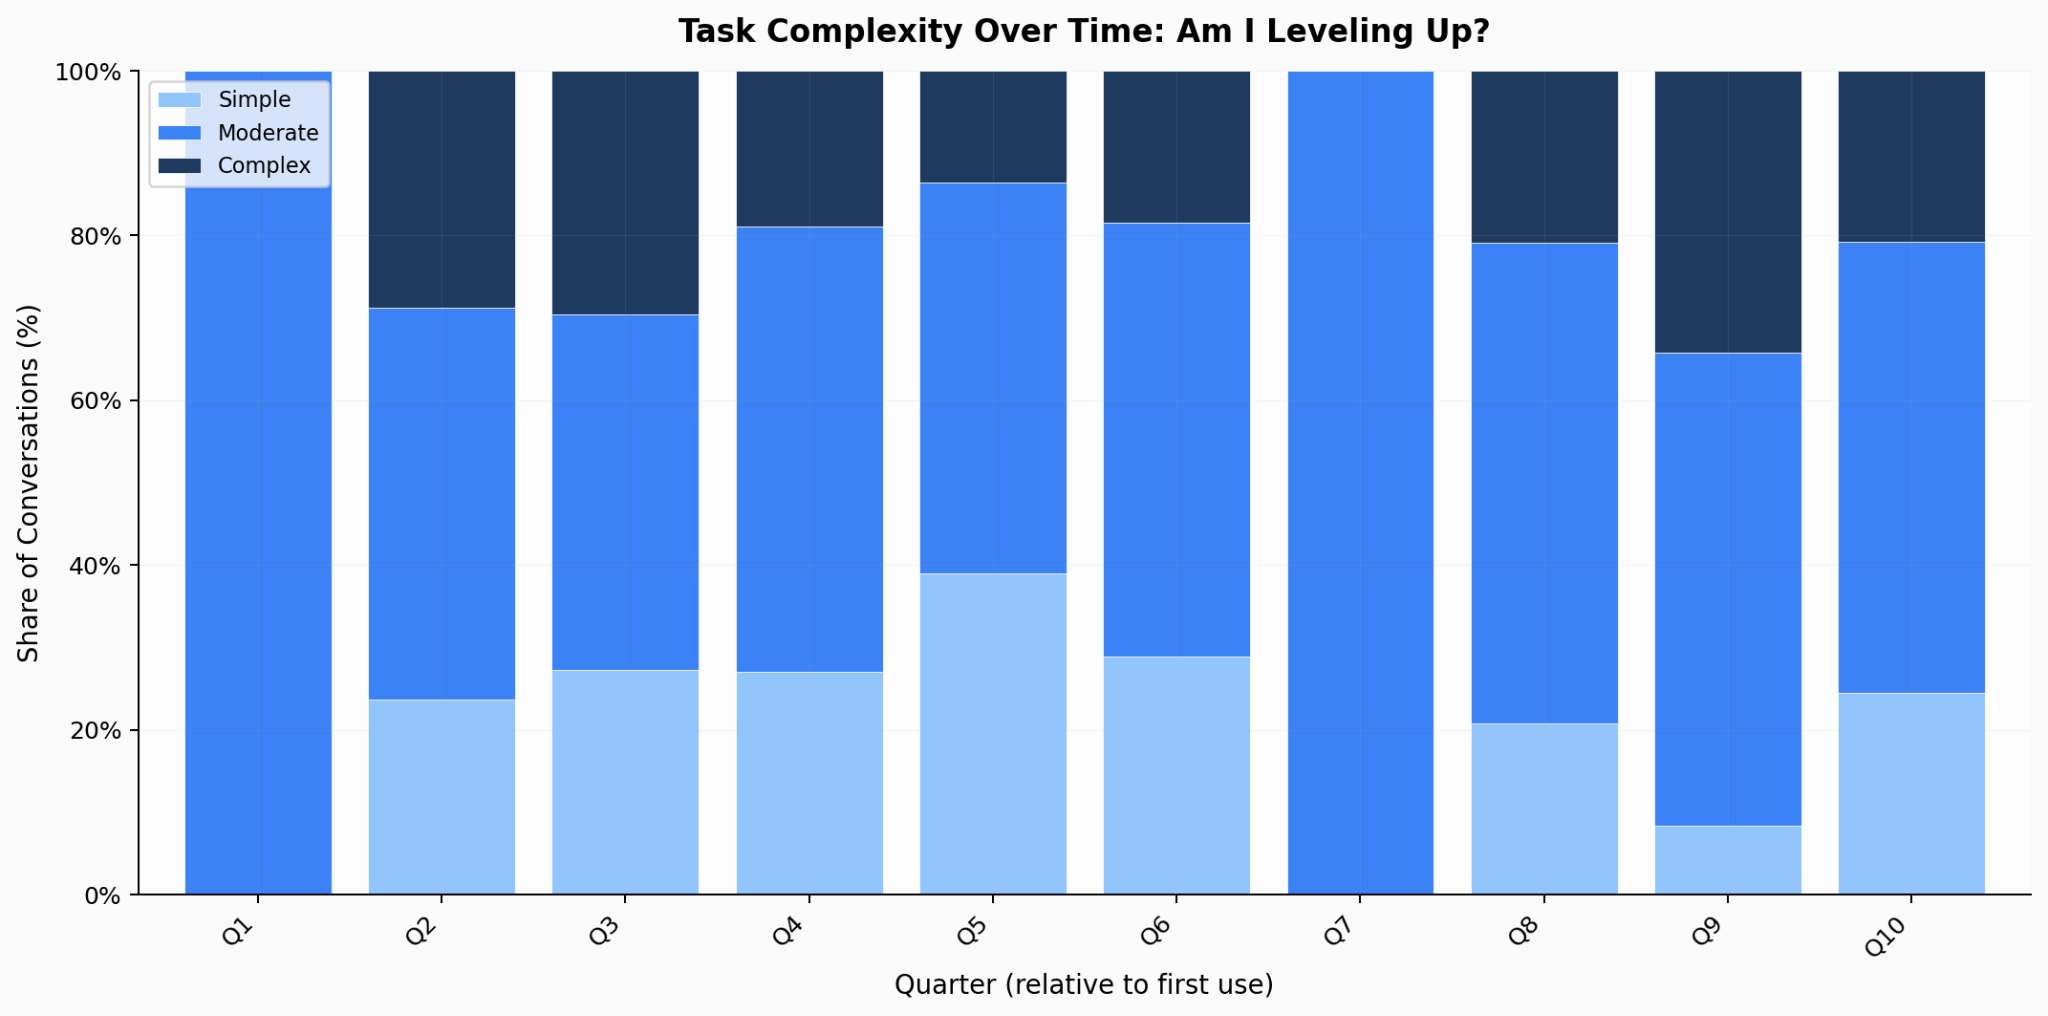
Task diversification mirrors the aggregate pattern, but more dramatically. My earliest quarter was almost entirely brainstorming. By my most recent quarters, I have seven or eight categories with a meaningful share in each category: coding, writing, research, data analysis, teaching preparation, and more.
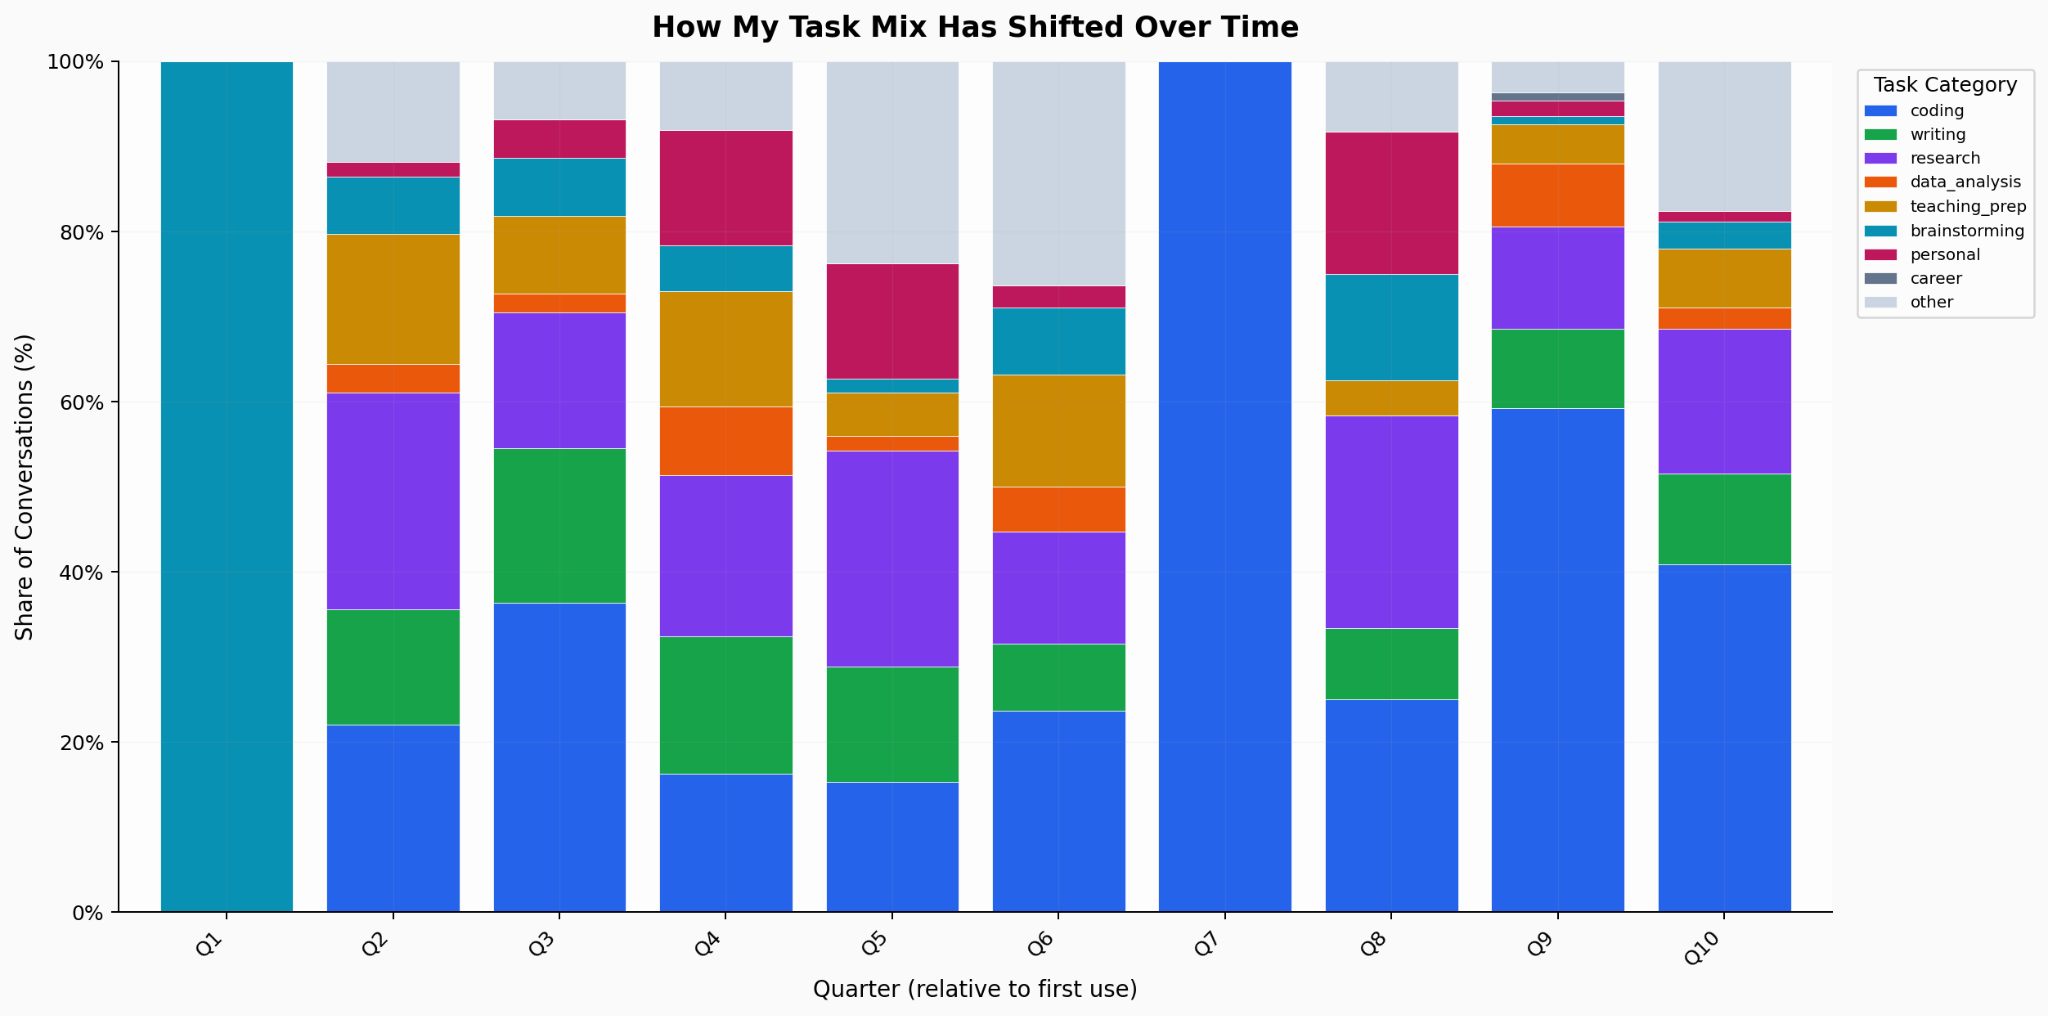
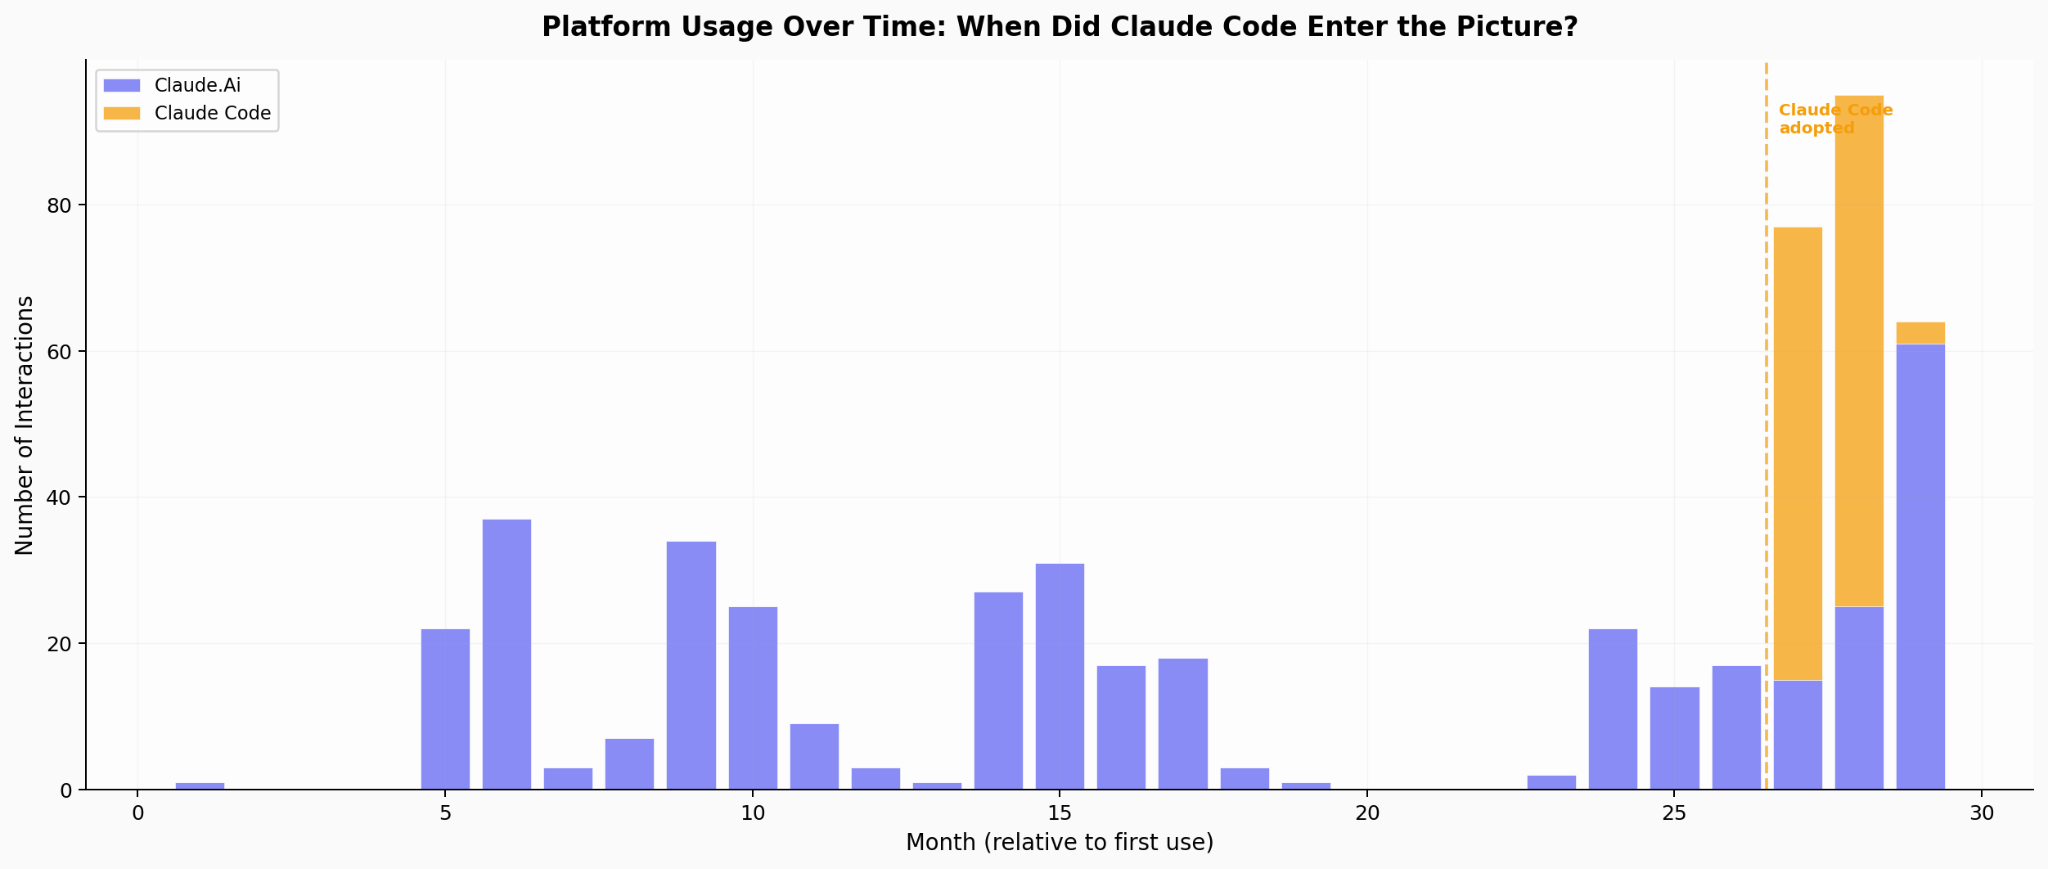
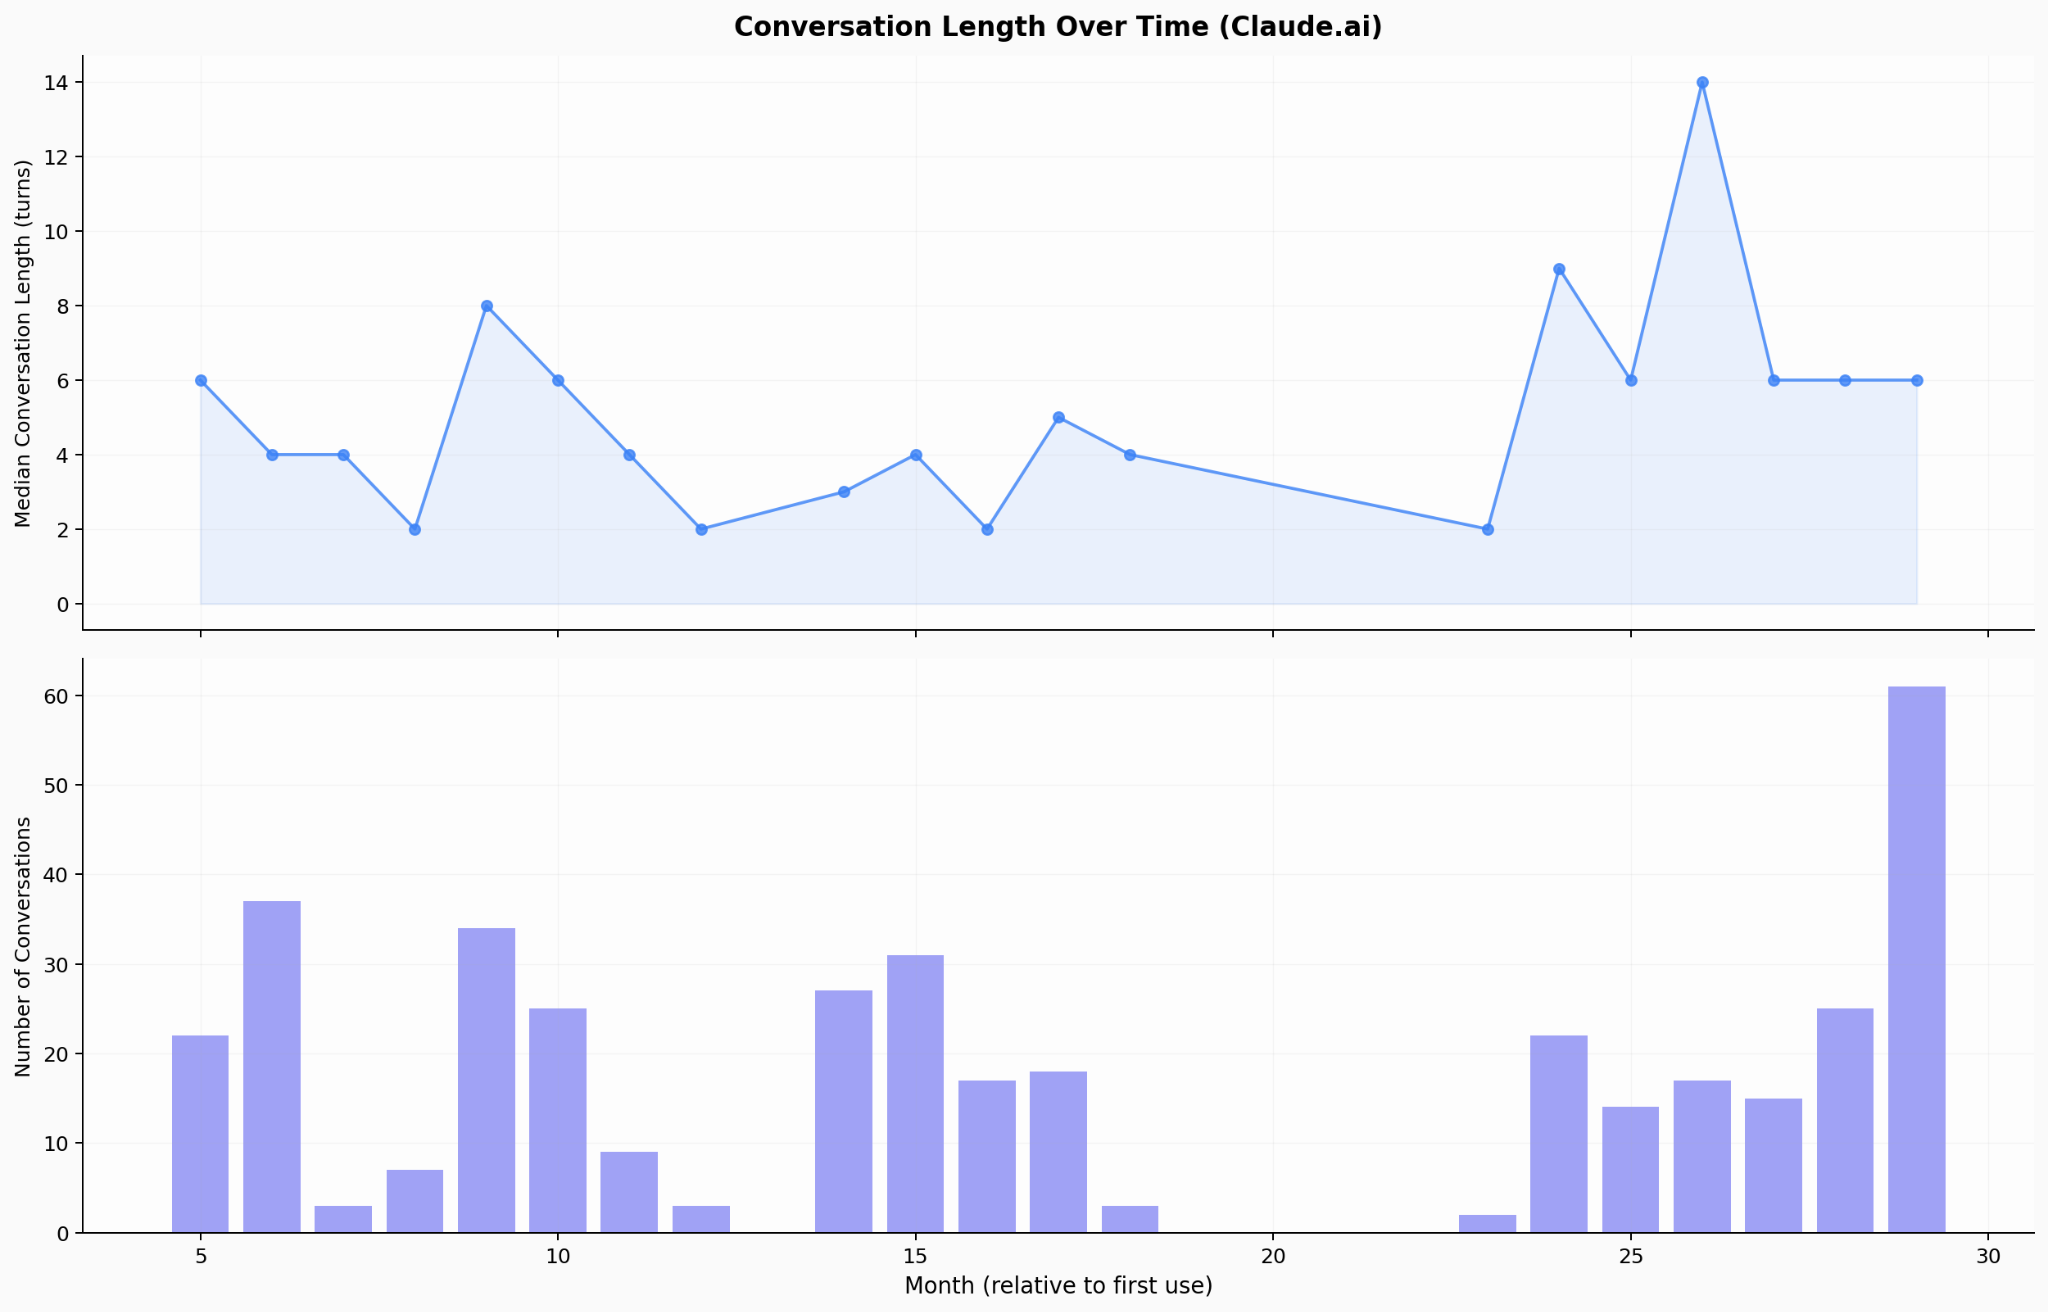
The coding migration story is me in miniature. Coding barely exists in my early quarters, then grows steadily to become my dominant category. 25% of my total usage is now Claude Code. I am the user the report describes when it talks about coding shifting from Claude.ai to API-based tools.
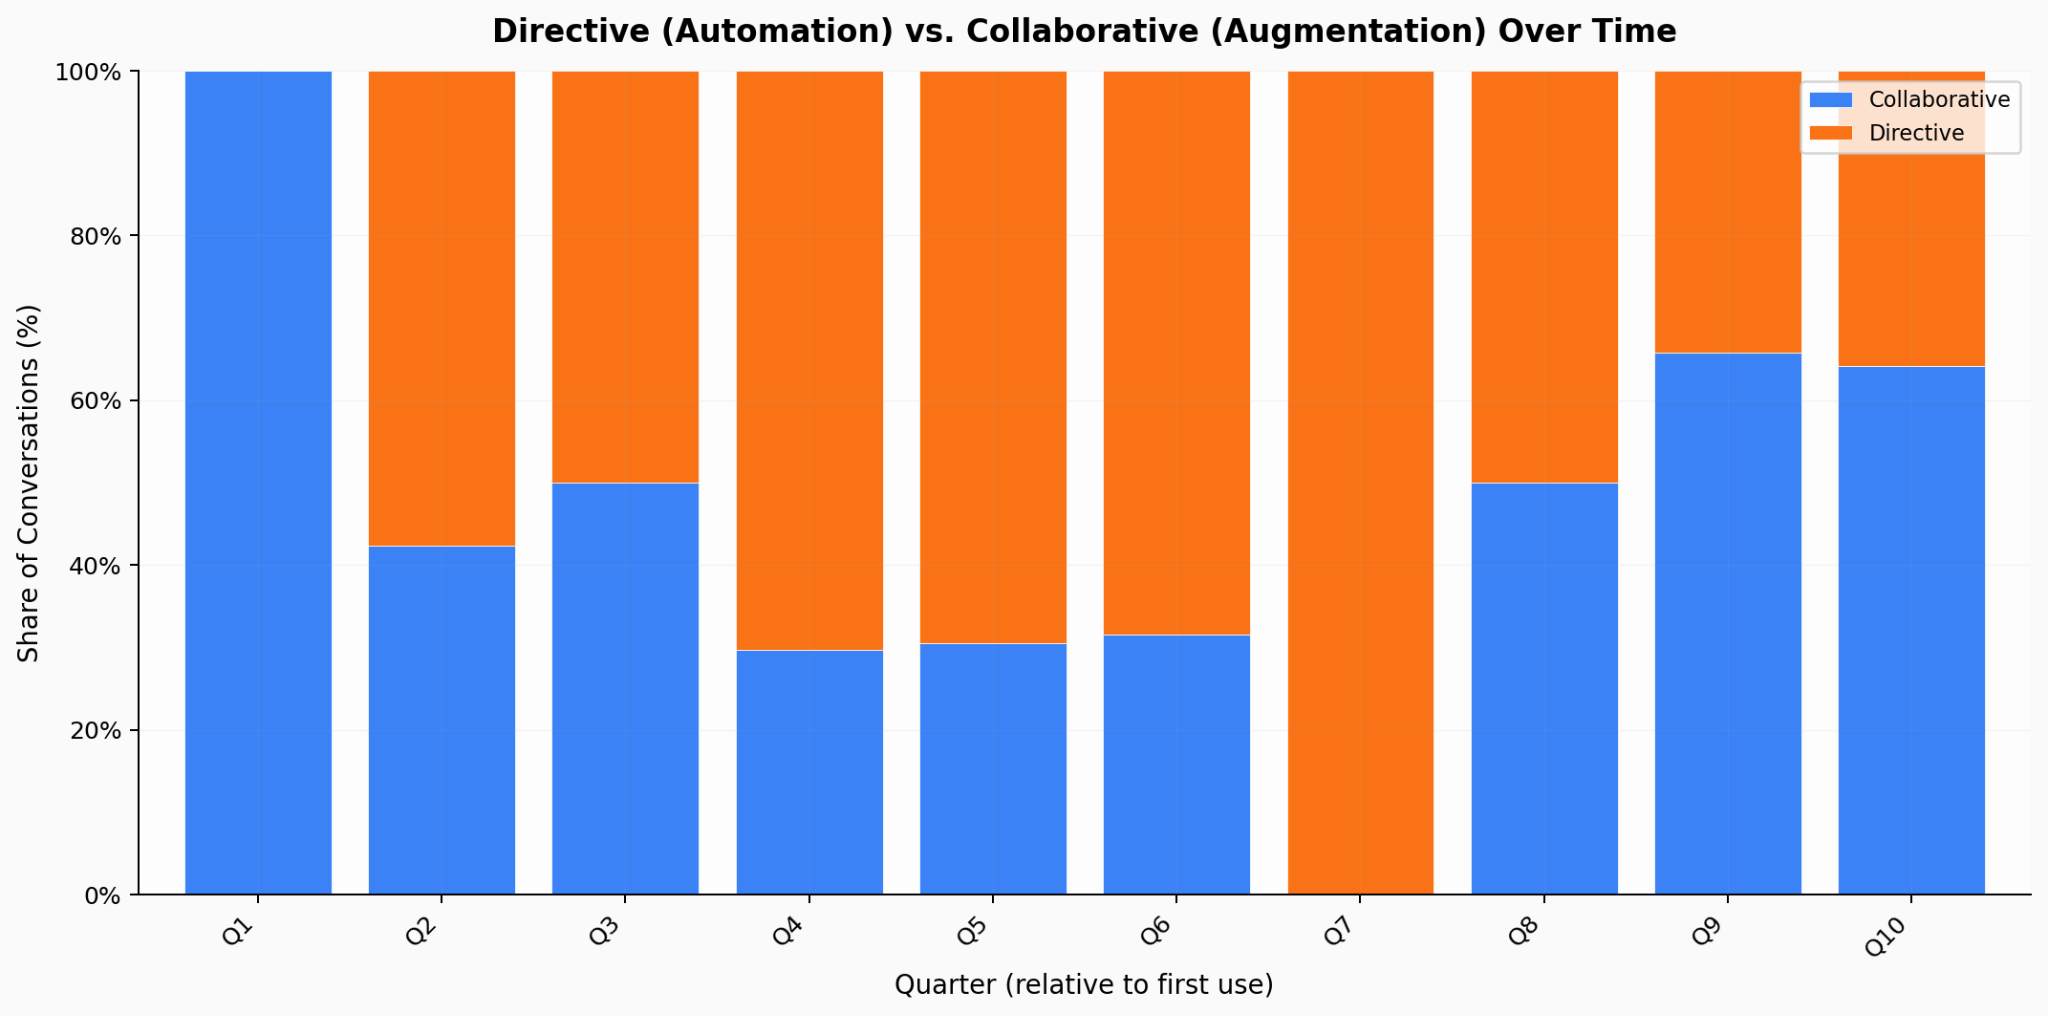
My interaction split is 52% collaborative, 48% directive — almost exactly even. This matches the report’s finding that us “veteran” users maintain collaborative patterns. I use Claude directively when the task is clear (Claude Code), collaboratively when I’m thinking (conversations like this one).
77% of my conversations are moderate-to-complex. Only 5% are personal. Against the report’s finding that new users devote 42% to personal use, this is a stark contrast.
And my conversation length is increasing, not plateauing. Median turns per conversation have spiked in recent months (9–14 turns).
(I had stopped my Anthropic subscription for a while in the middle, and I suppose I should be cleaning up this data a little better. But I happily plead guilty to YOLOing this: I had an idea, asked Claude Code to do its thing, and I’m just inserting these charts as is into this post.)
I am not a representative user. I’m what they’d call a power user (at least for someone who is certainly not from a software background), an economist who thinks about AI professionally, and someone who treats Claude as an intellectual sparring partner rather than a tool. But this is pure guesswork on my part, and that is worth keeping in mind. And part of the reason I included this section is to incentivize you in doing this for yourself, of course.
What I’ll Be Watching In Weeks (Days?) To Come
A few predictions and things I want to track as future Economic Index reports come out:
The March data will capture the DoW/Anthropic confrontation. Did the supply chain risk designation and surrounding media coverage drive a new wave of adoption? If so, was it the Super Bowl pattern again (casual users, diversification) or something different?
Automation on Claude.ai should be the leading indicator. As the new cohort of users matures, I predict their usage will graduate from “What can you do?” (exploratory, personal) to “What can you do for me?” (task-specific augmentation) to “Just do it” (automation, directive patterns). Tracking the automation share on Claude.ai specifically might show whether the broad user base is making this transition.
The cross-country divergence is the metric that matters most for policy. If AI skill is accumulated through use, and use requires a basic level of institutional willingness to experiment, then the countries falling behind today are building a deficit that gets harder to close. This isn’t just about access to models. It’s about building cultures of adoption. And unlike supply-side gaps, which markets and infrastructure investment can close, demand-side gaps require something harder: changing how institutions think about work. I am pessimistic about this, so please tell me why I’m wrong.
The domain-specific tools question. Will AI exposure for healthcare, engineering, and management occupations increase as AI moves from chat interfaces to embedded tools and/or robotics? Or are the barriers more fundamental than interface design? The gap analysis suggests the answer will not come from chatbots getting smarter. Serious question: how much smarter can the chatbots possibly get?
And that is a concrete reason to watch both AI developments in the weeks to come, and to eagerly await the next edition of this report.
The Anthropic Economic Index data is publicly available on HuggingFace. The personal usage analysis described in this post was conducted using anonymised data; raw conversation data is not shared nor published. All original analysis was done with/by Claude Code — which is, I suppose, the point.
Wow. Thanks, for this Ashish.
After reading this, I went and built a self-reflection tool with the help of Claude. The tool runs locally, never leaves the machine.
Premise: Self reflection based on the conversation with your AI assistant.
https://github.com/criatvt/claude-mirror
Ashish — the cross-country divergence is an area I'm keeping an eye on. Within-US convergence, but top 20 countries pulling away from the rest: you frame it as demand-side inequality — "institutional culture, work patterns, organisational willingness to experiment." That's correct, and it's stickier than access.
I also see a topology-dependent disruption — AI bites where economies are already legible, digitized, SaaS-eaten. Your interface tax point reinforces it: software devs have near-zero friction, dentists face enormous cognitive load. The geography of adoption may follow the geography of prior formalization.
I wrote something adjacent — where new work appears in the cracks as AI stalls at the edges. Different angle, same underlying question: where does the friction live, and who ends up working it? https://rajeshachanta.substack.com/p/the-last-meter-economy
The Econ Index offers the first real data set for testing the topology thesis at scale. Would love to see someone map adoption rates against proxies for economic legibility — share of workforce in SaaS-adjacent roles, digital payment penetration, etc.