
A Delightfully Teachable Moment

Along with every other cricket tragic in this great nation of ours, I await developments on Day 4 of the match with great anticipation (and a feeling of dread which none of us will refer to again). But in the meantime, to fill up the dreary non-cricket-match hours, here is a most delightful scorecard for your consideration.
(H/T: Abhishek Mukherjee)
What is unusual about it?
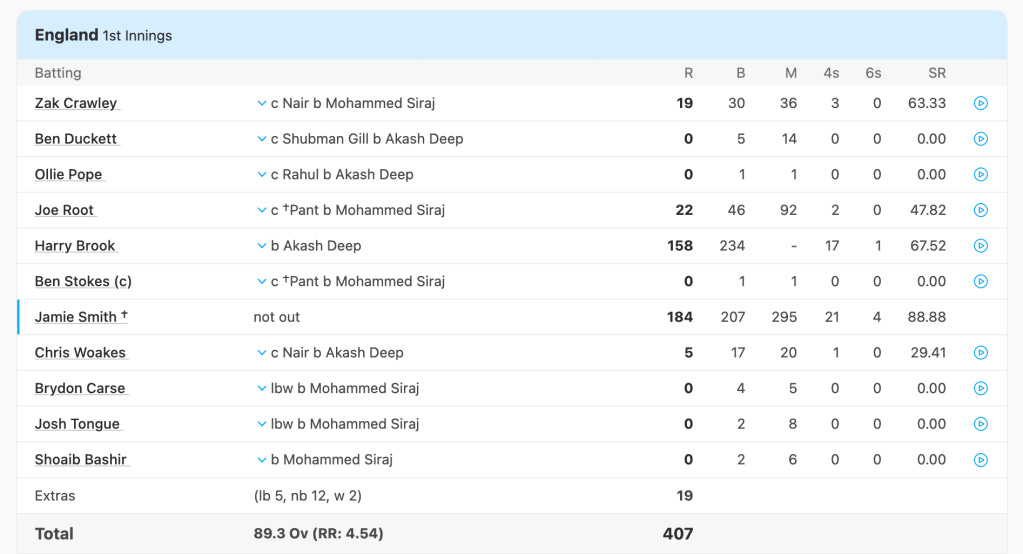
Six ducks, all you cricket fans will chirp with great enthusiasm. And you'll be right, of course.
But what if you were a student (or a teacher. Same difference) of statistics? Then is anything unusual about this scorecard?
What is the mode for this dataset? 0, of course, because six different people got a duck.
What is the median for this dataset? 0, of course! When we sort the eleven scores, the middle value (the 6th score) is 0. This means that fully half the team (and then some!) failed to score, while the other five batsmen scored more than a duck. The value that splits this dataset into halves is... 0!
If you knew nothing about this match, nothing at all, and I came and told you that the median score for England was 0, would you expect to feel happy or sad?
If you knew nothing about this match, nothing at all, and I came and told you that the modal score for England was 0, would you expect to feel happy or sad?
Would you expect England's actual score to be 407?
On the other hand, if I told you that the arithmetic mean was 37 (I've included extras), what would you expect the range of the data to be?
What, in your opinion, is the best "descriptor" of this dataset? Mean, median or mode? None of these and something else? If something else, what? If one of these, which one, and why?
What a lovely introductory class to stats this would be.
Oh, and all the best to everybody for Days 4 and 5!